Fair warning that the stuff in here is using bleeding-edge technology and is not for the faint of heart. It is not that flexible nor mature, but if you’re like me and like to torture yourself with cool new stuff, let me save you some time with the environment setup.
First thing you’re going to need is "emscripten" which is a great C/C++ toolchain that can target WebAssembly (and asm.js). There is growing support in other compilers like Clang which I believe can target WebAssembly, but a huge plus with emscripten is that it provides ease of access to some commonly used C++ libraries. For example, it has some support to map sockets to WebSockets, or OpenGL to WebGL to make porting easier, all without having to get dirty with JavaScript. Native support for Web APIs is very limited right now for the WebAssembly side.
I’ve been playing with WSL2/Ubuntu, so this article will assume that environment.
Installing is easy:
mukunda@superbim:~$ git clone https://github.com/emscripten-core/emsdk.git
mukunda@superbim:~$ cd emsdk
mukunda@superbim:~/emsdk$ ./emsdk install latest
mukunda@superbim:~/emsdk$ ./emsdk activate latest
There is some environment setup here, but in my vscode task files I just assume emsdk is located in the home folder and call it directly.
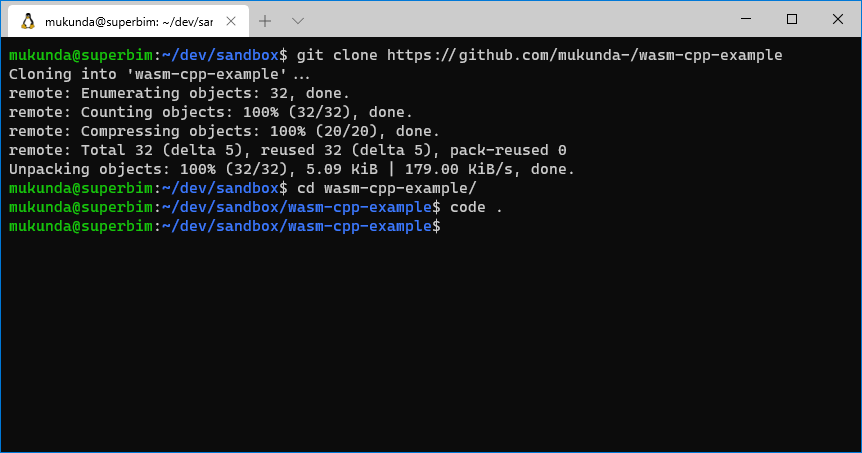
Once you have that set up comfortably, you can clone my example repo.
https://github.com/mukunda-/wasm-cpp-example
This is a bare-bones hello world project that targets WebAssembly. It’s based off of one of my more complicated setups, but I stripped it down to just support “debug” mode. You’ll need a few tools if you don’t have them already, like CMake
sudo apt-get update && sudo apt-get install cmake
It’s easy to connect to the code remotely with VS Code, just type "code ." in the folder. If you haven’t done this yet, the VS Code server will install itself automatically first.
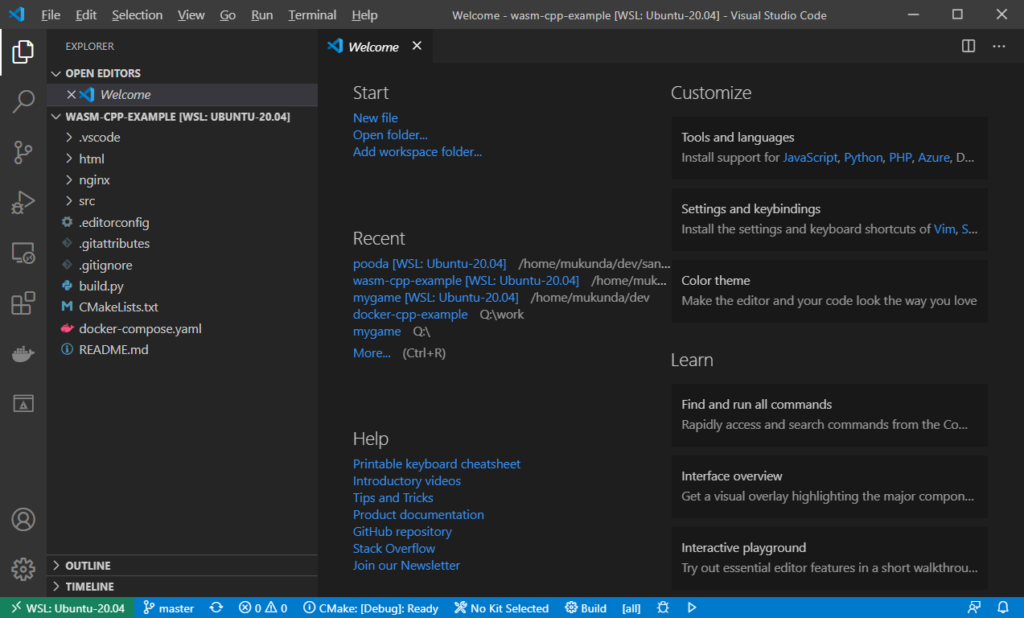
To build this project, just press Ctrl+Shift+B to run the default build task. You will see it open a terminal to run CMake and build.
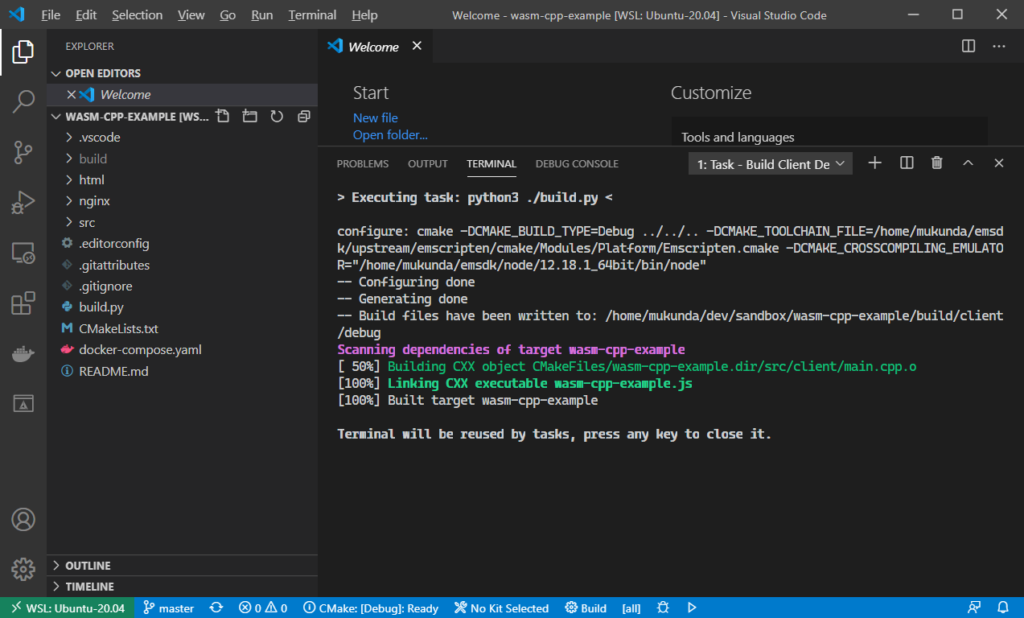
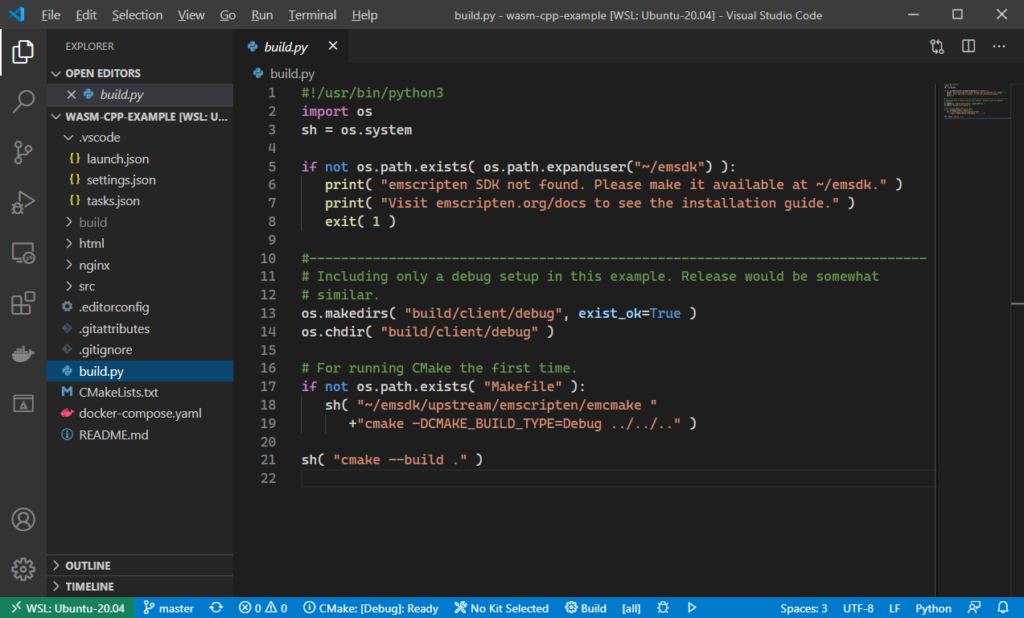
Basically, it’s just a task to call build.py, a simple Python script to build into the subdirectory:
build/client/debug
I have it structured like that to separate the build targets because in my project the server and client are using both different architectures and compilers.
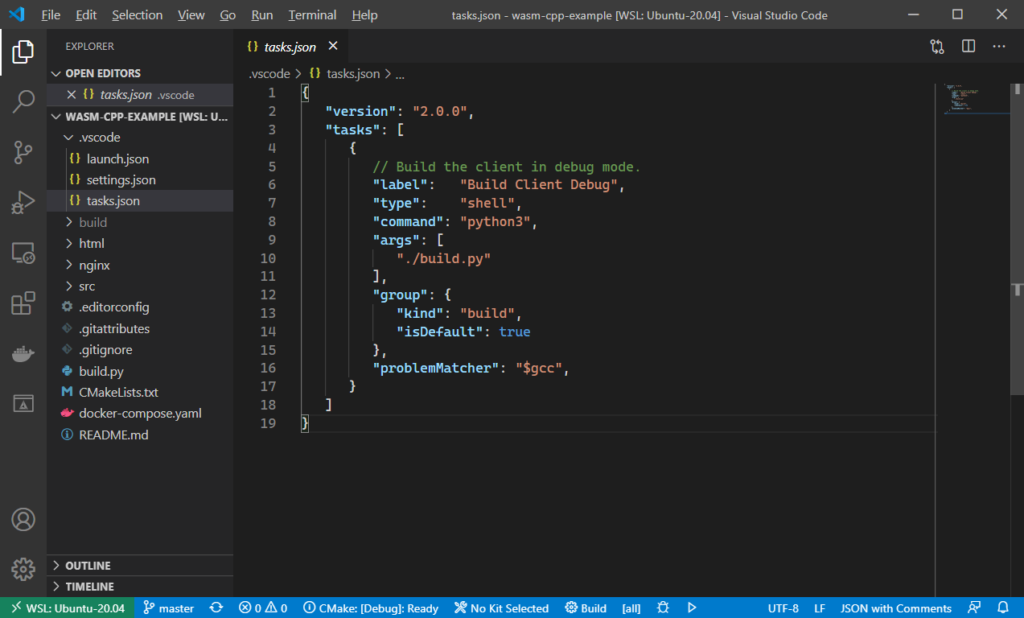
The $gcc problem matcher is to specify how to capture the console output to find compiler warnings and errors. This should be mostly accurate for GCC-like output.
Now we can test our code. emscripten will generate three files of interest:
- wasm-cpp-example.js - The JS loader that will execute our WASM program.
- wasm-cpp-example.wasm - The compiled WebAssembly output.
- wasm-cpp-example.wasm.map - The sourcemap for browsers to consume to set up debugging.
The sourcemap file maps code between the binary and our program. We build it using a special -g4 compilation options, as well as a --source-map-base option to tell the browser where to look for our sources.
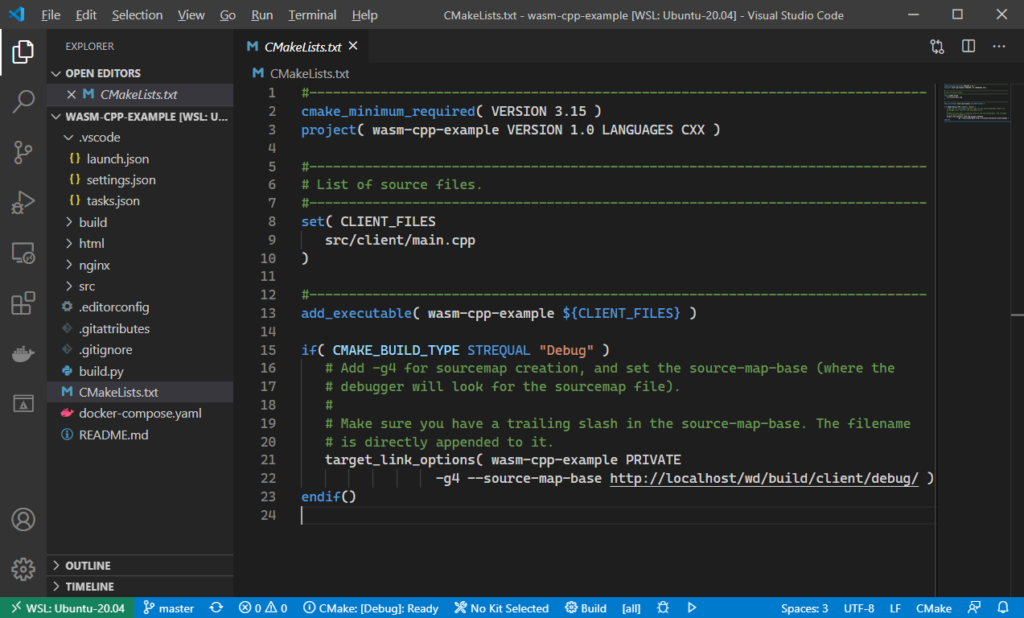
Our testing webserver will host our working directory at /wd, for the browser to read from. The --source-map-base was a bit of a struggle to figure out, and I think tools could improve in that regard (unless there is something I’m misunderstanding).
When compiling in that build folder, the paths to source files will be something like ../../../src/client/main.cpp. The source map will contain those paths, and the browser will look relative to where it finds the sourcemap file. In other words, you can’t move the sourcemap file around or you’ll get the wrong paths.
To host our code for testing, I added a simple nginx server. To start it, run docker-compose up on the command line.
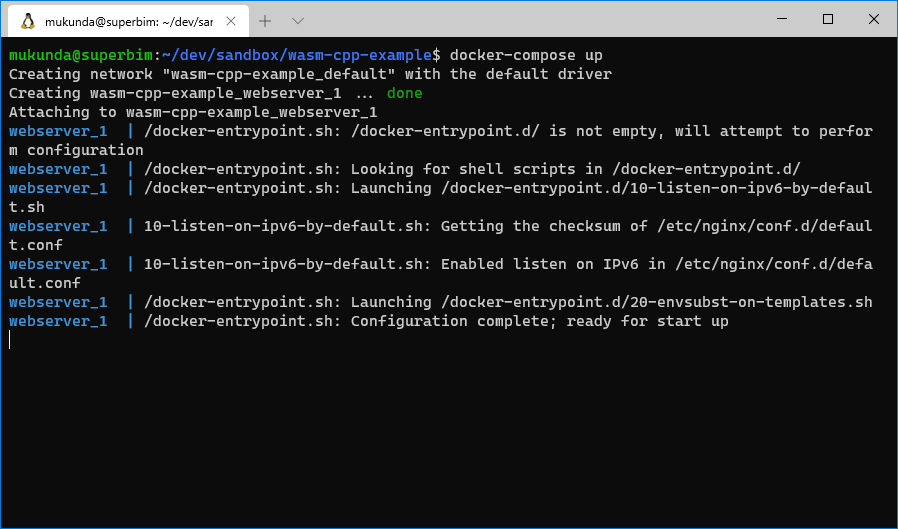
This will attach your shell to the webserver output, unless you specify the -d option. I like seeing the output and just open a new terminal. Here is the compose configuration:
version: '3'
services:
   # Server to host our test environment.
   webserver:
      # Custom image based off of nginx. See ./nginx/Dockerfile
      build: ./nginx

      # Expose the http port.
      ports:
         - 80:80

      # Mount the working directory read-only to /wd.
      # A custom dockerfile sets up the nginx html folder to /wd/html
      volumes:
         - .:/wd:ro
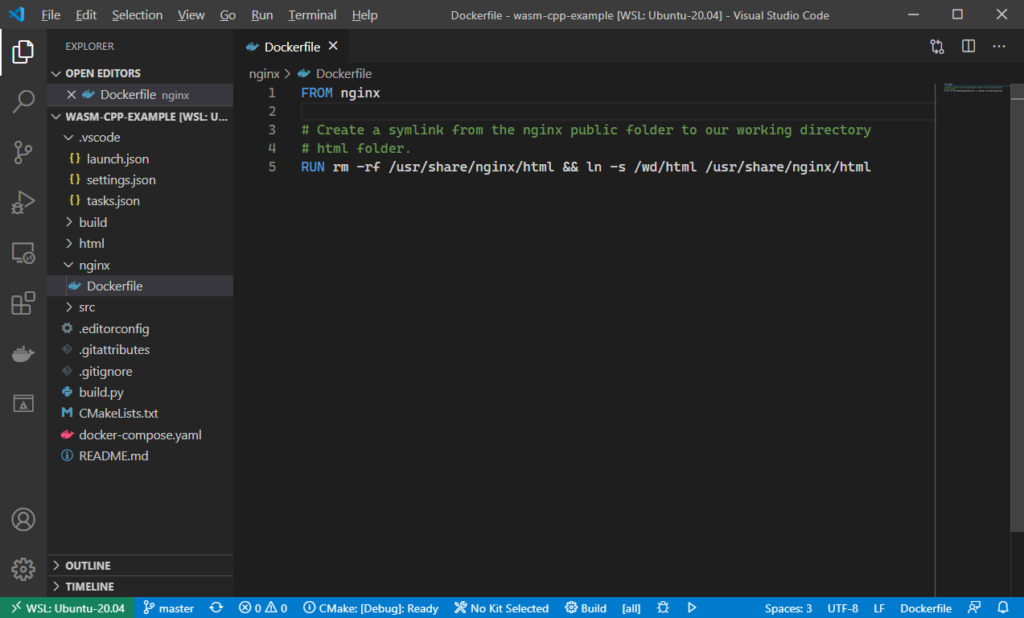
The working directory is mounted to /wd in the container, so the webserver can host any source files needed for debugging in the browser. We’re using a slightly modified nginx image, basically just to symlink our html folder to be the public site for testing on.
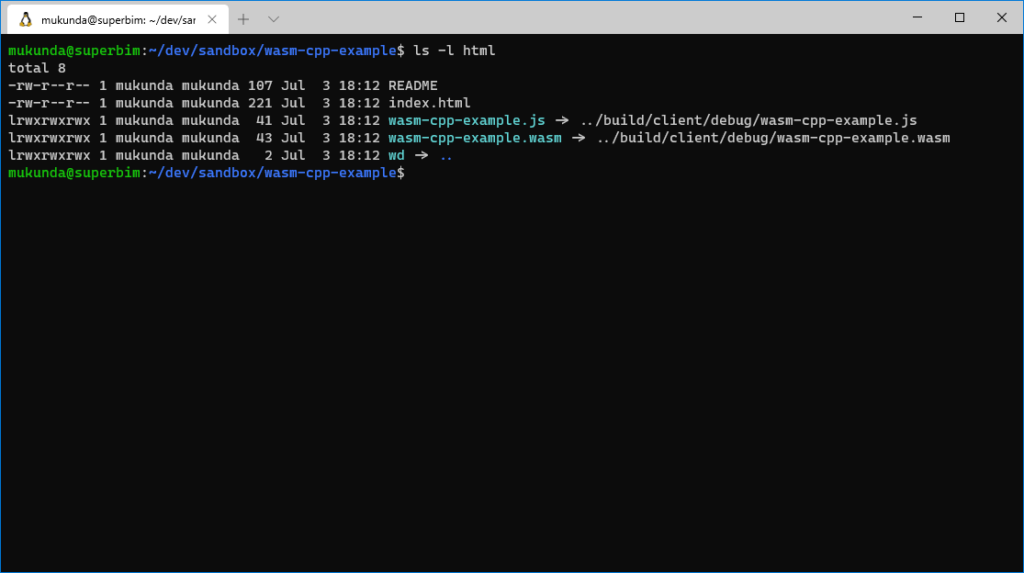
The html folder just contains an index.html to load our wasm file, as well as symlinks to access the working directory (so it is accessible from http://localhost/wd), the compiled WebAssembly binary, and the glue (JS file to execute it).
To help you understand the /wd magic better, take for example src/main.cpp which will have the path ../../../src/client/main.cpp since it was compiled from the build directory. The browser will look for it at
http://localhost/wd/build/client/debug/../../../src/client/main.cpp
which is the source-map-base linker option we set plus the source path of the file. With our webserver setup, this maps to
{workspace}/html/wd/build/client/debug/../../../src/client/main.cpp
or simply
{workspace}/html/wd/src/client/main.cpp
or, more simply,
{workspace}/src/client/main.cpp
since /wd is a symlink to the workspace. Yes, this was very confusing to me, too.
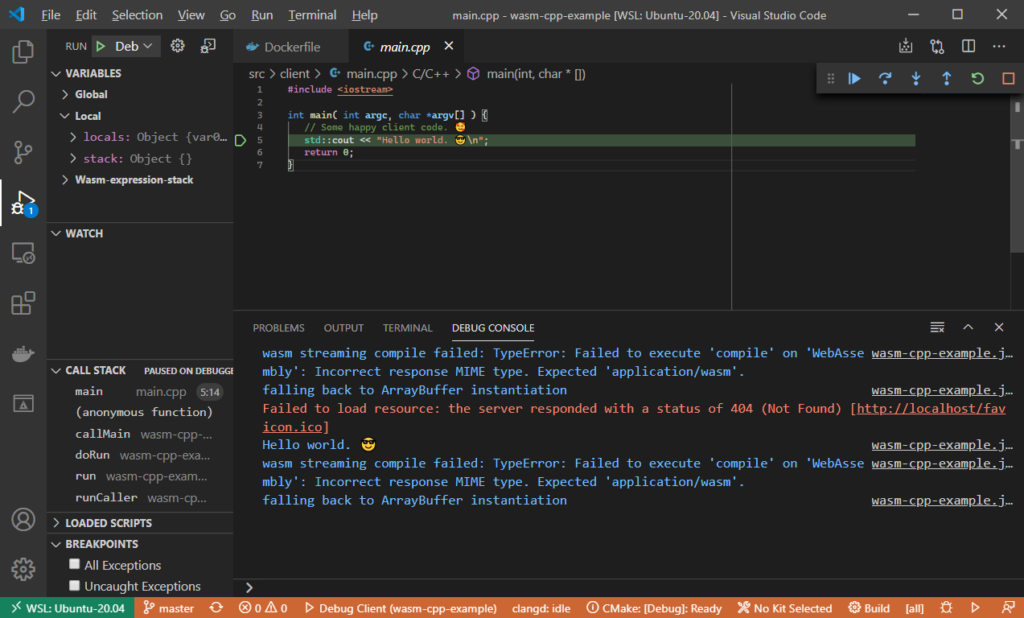
Finally we can launch and debug. Here is launch.json which configures that.
{
   // Use IntelliSense to learn about possible attributes.
   // Hover to view descriptions of existing attributes.
   // For more information, visit: https://go.microsoft.com/fwlink/?linkid=830387
   "version": "0.2.0",
   "configurations": [
      {
         "name":          "Debug Client",
         "type":          "chrome",
         "request":       "launch",
         "url":           "http://localhost",
         "preLaunchTask": "Build Client Debug",
         //---------------------------------------------------------------------
         // You can use Chrome for Developers like this:
         //"runtimeExecutable":
         //              "C:\\Program Files\\Google\\Chrome Dev\\Application\\chrome.exe",
         //"runtimeArgs": [
         //   // Disable extensions and user profile.
         //   "--guest",
         //   // Open devtools on startup.
         //   "--auto-open-devtools-for-tabs"
         //],
         //---------------------------------------------------------------------
         // Not 100% sure how this works but here are my thoughts:
         // When building in workspace/build/client/debug, the path to the
         // source file will be for example "../../../src/client/main.cpp"
         //
         // When Chrome loads our sourcemap at
         // "//localhost/wd/build/client/debug/wasm-cpp-example.wasm.map"
         // it will use that same path to find the source files, so we should
         // specify the path to there.
         //
         // And to clarify, this is for us (vscode), not Chrome. If we're
         // running vs code remote to WSL, then it will still map correctly.
         // Without this, vscode won't know where to look for files when
         // debugging.
         "webRoot": "${workspaceFolder}/build/client/debug",
      }
   ]
}
There are some instructions in here to use Chrome for Developers if you want. webRoot is important to configure if you want to map the source files to the working directory; it’s also sort of awkward because of the paths weirdness talked about above (pointing to the build folder rather than something more sane).
You need to install the Debugger for Chrome extension to implement the “chrome” launch type and connect to its debugger. This extension is installed locally rather than on the remote side and will spawn a browser window locally to connect to the test webserver (http://localhost).
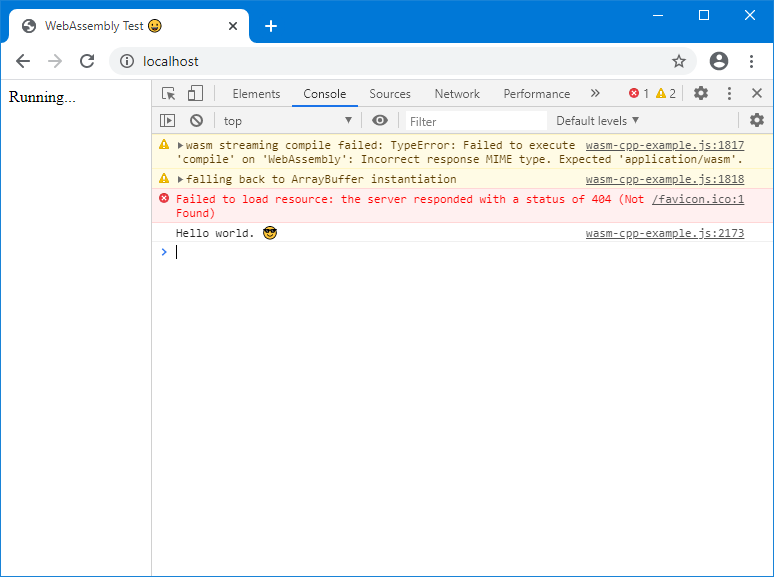
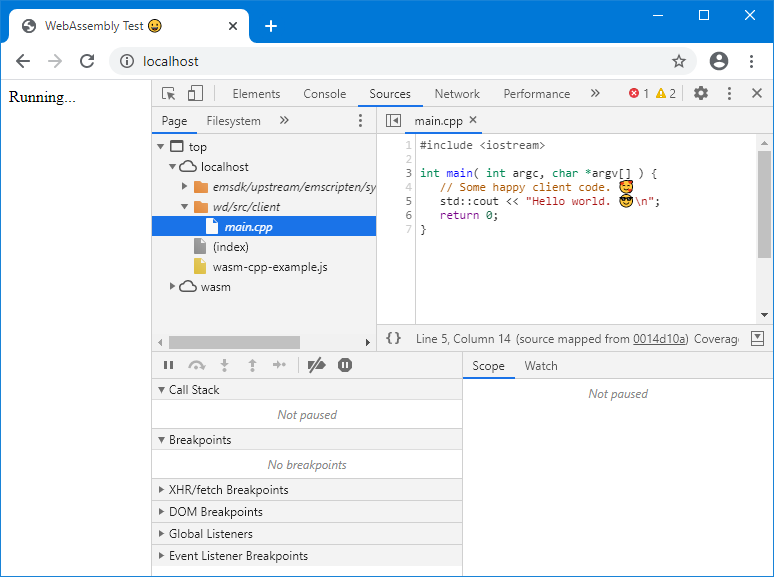
With all that, you can press F5 to launch, and a browser window should open. Opening the console window in the inspector should show our hello world output.
Then if you navigate to sources you can check if the source map is working correctly. You should see /wd/src/client in the page sources, and you should be able to view them.
You can set breakpoints in the browser or in VS Code. I couldn’t figure out how to launch chrome with debugging to catch breakpoints in the first run, but when you reload the page the breakpoints will trigger.
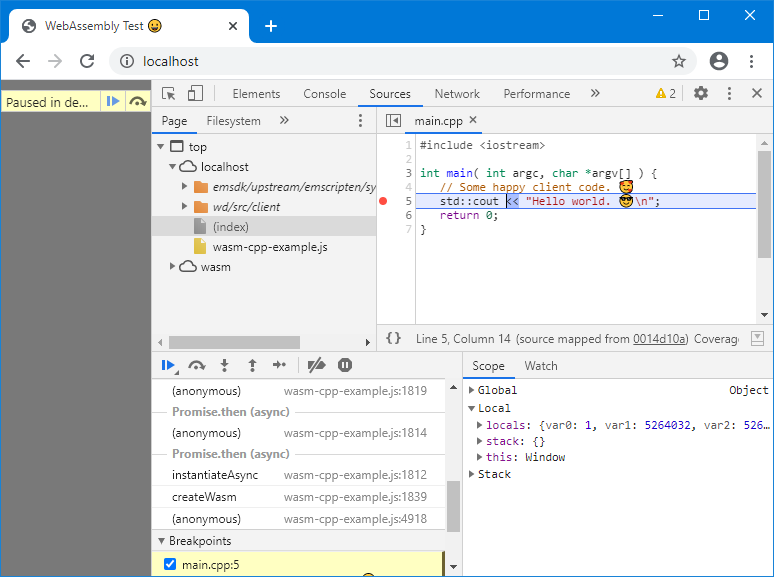
I believe these are all very new and under-development features, so you may run into some strange behavior. For example, when you want to step over (F10), it seems to step over the underlying wasm instructions rather than C++ code, so you will have to click a few times for each line of code.
When you’re done playing around, you can shut down the web server with docker-compose down.

Good luck with your WebAssembly project!